Diffusion Couple with Uniform Composition Input
In this tutorial, the diffusion simulation on a diffusion couple with uniform composition at each side (as shown in Figure 1) is carried out. The annealing temperature is 1000 °C and the duration is 2 hours. “Region_1” represents the left-hand side of this diffusion couple, and “Region_2” represents the right-hand side of this diffusion couple. Each region is 100 μm and the simulation box is discretized to 100 grids.

Set up Initial Condition for Diffusion Simulation
In order to set the above conditions in PanDiffusion, click through the menu bar "PanDiffusion→ Diffusion Simulation", or by clicking ![]() on the Toolbar., a popup window will show and allow user to set up calculation conditions (as shown in Figure 2 and Figure 3).
on the Toolbar., a popup window will show and allow user to set up calculation conditions (as shown in Figure 2 and Figure 3).

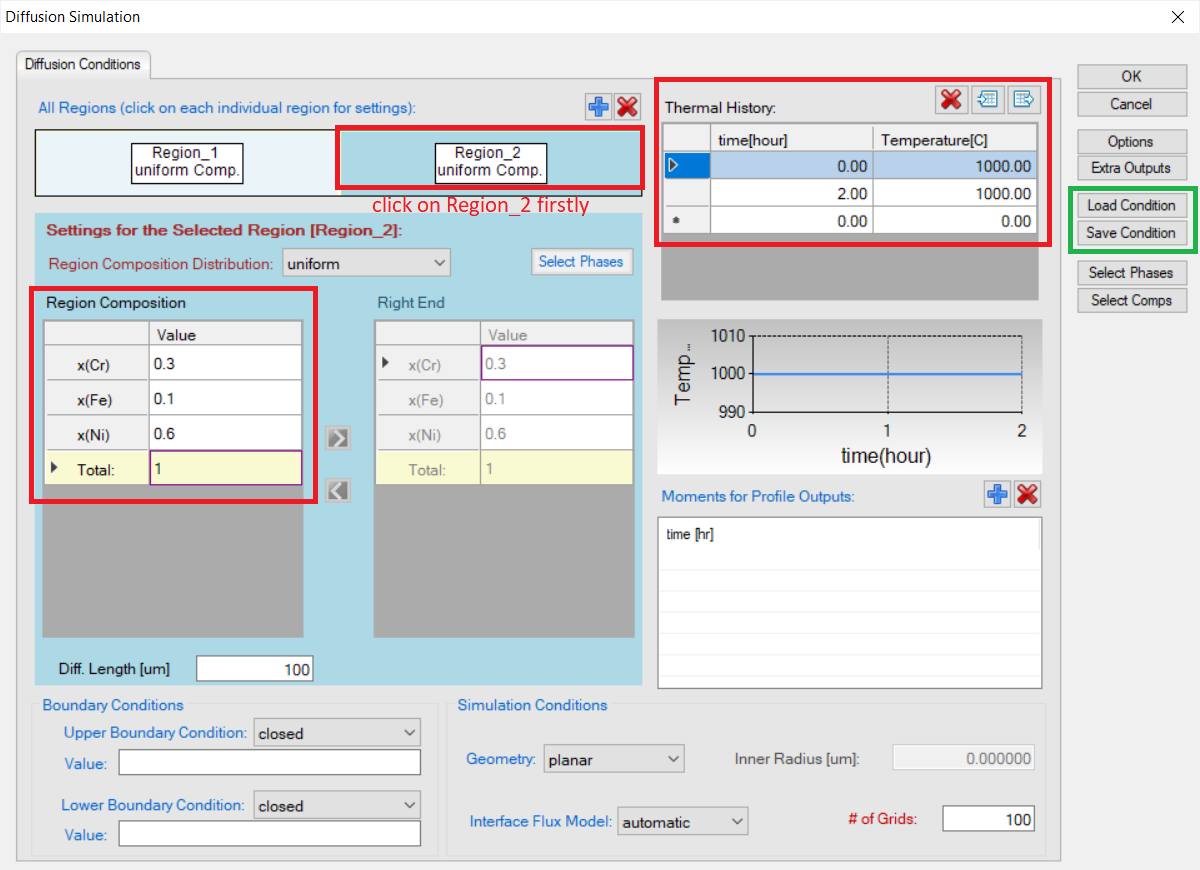
Figure 3: Dialog window for user to set the composition of Region_2 and diffusion simulation conditions
Click Region_1 to set up the composition of the left-hand side as shown in Figure 2, and click Region_2 to set up composition of the right-hand side as shown in Figure 3. Details regarding the interface design will be described in Section Settings in General Diffusion Simulation. Constant annealing temperature is set as 1000 °C, and annealing time is 2 hours.
As is highlighted by the green box in Figure 3, the simulation condition can be saved to a “.pbfx” file by selecting “Save Condition”. The saved condition can be loaded by clicking “Load Condition” for the future usage. When a condition is loaded from “.pbfx” file, the settings in the GUI are updated accordingly.
Simulation Results
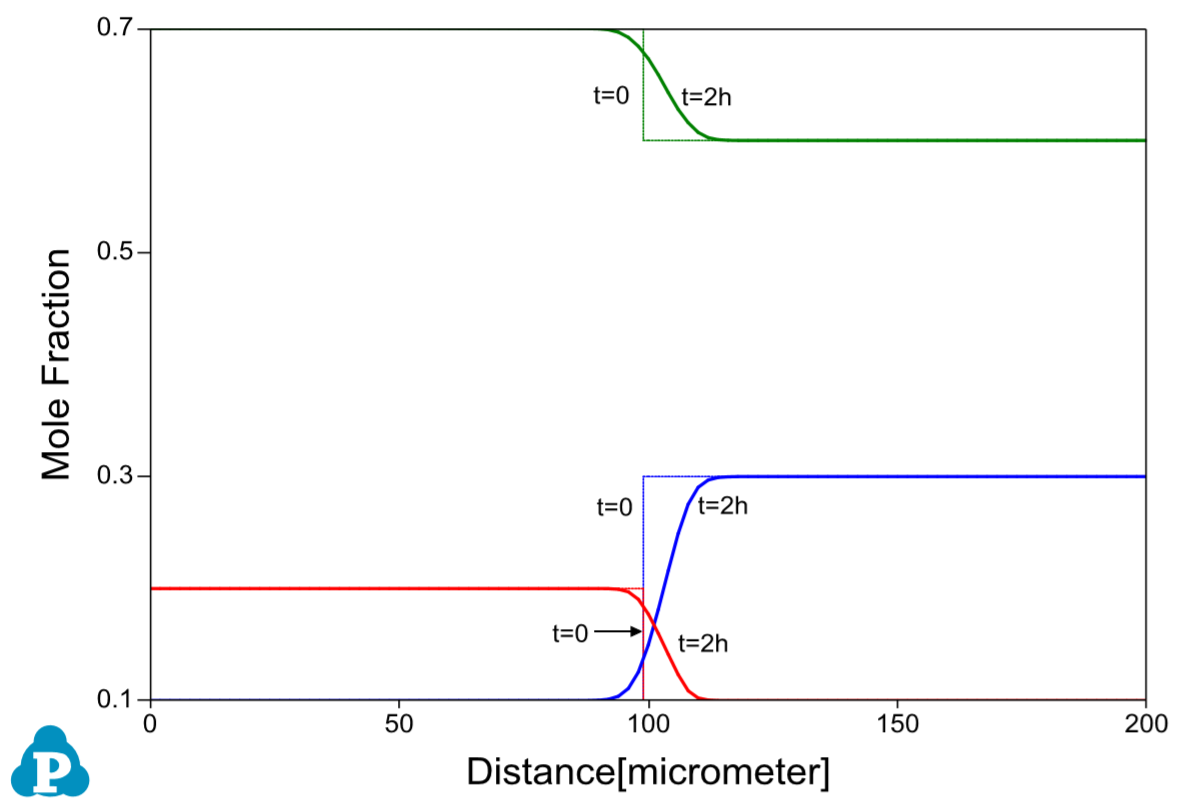
Click OK button in Figure 3 to start the simulation after the initial condition is set properly. The simulation result is displayed in Figure 4.
In this case, only the initial and final composition profiles are presented: the dotted lines with sharp interface are for the initial stage and the solid lines with smooth interface are for the final stage.
Customize Simulation Results
As all other calculations available in Pandat™, upon the completion of the diffusion simulation, a default table of properties (such as time, temperature, grid size, distance, composition distribution, volume fraction and chemical potential) is automatically generated and a default graph of composition profiles is displayed. User can refer to Section Graph and Section Table to learn how to customize simulated graph and table.